
School Data Analytics and Visualization
Creating Data-Driven Insights to Improve Decision Making
LiveBook is a comparative analytics technology that helps educators associate content, visualize data, and explore relationships.
This integrated data analytics platform automatically merges the data from AdminPlus with schoolwide assessments uploaded from external sources to create comprehensive tables and charts. Visual formats are added to help interpret the data which empowers school staff to quickly pinpoint patterns, differences, and trends which leads to better decision making for evidenced-based solutions.
The Problem:
- Multiple Sources:
Assessments are stored on different sites (i.e., State DOE, College Board, NWEA) with varying score interpretation guidelines.
- Unique Needs: Administrators, school counselors, specialists, and classroom teachers need the same data on distinct groups of students.
- Searching for Trends:
Identifying correlations and trends when looking at separate data table assessments can be challenging.
- Constantly Changing: Program statuses change over time (such as Special Ed and ELL). It can become difficult to keep up with the latest information.
- Manual Processes: Teachers must walk down to the office to pull a student’s file to see their assessment history.
- Time and Effort: Extra labor and time needed to extract and compile the necessary information from various sources - deciding which data fields to keep and which to exclude.
- Quickly Outdated: Timely distribution of finalized compiled data to school staff is difficult for IT/Data Managers to keep up with.
The Solution: LiveBook
- One Source: All assessment data is already uploaded and stored in one place - the LiveBook site.
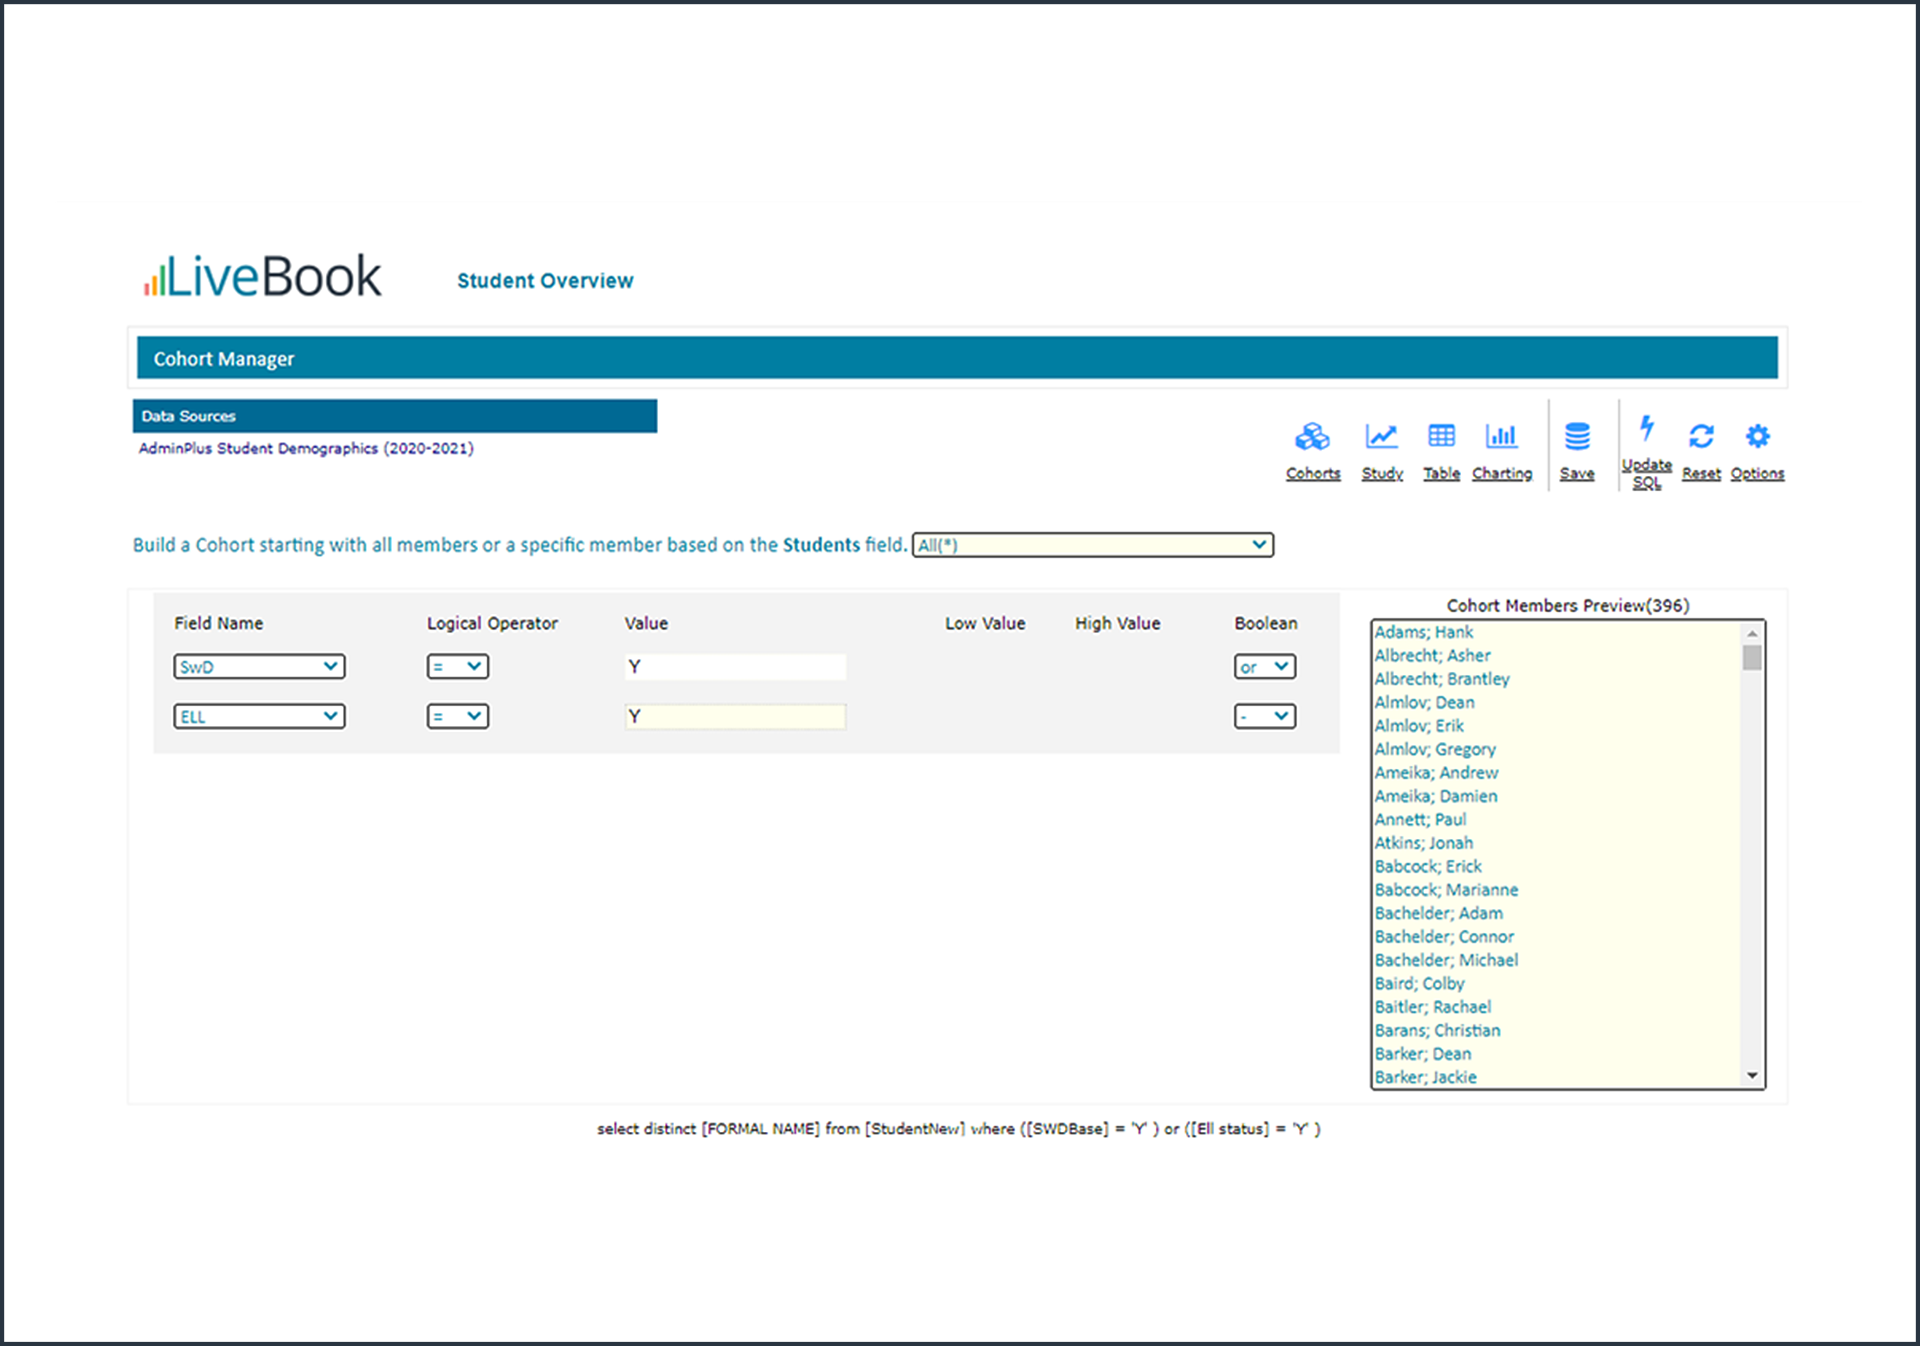
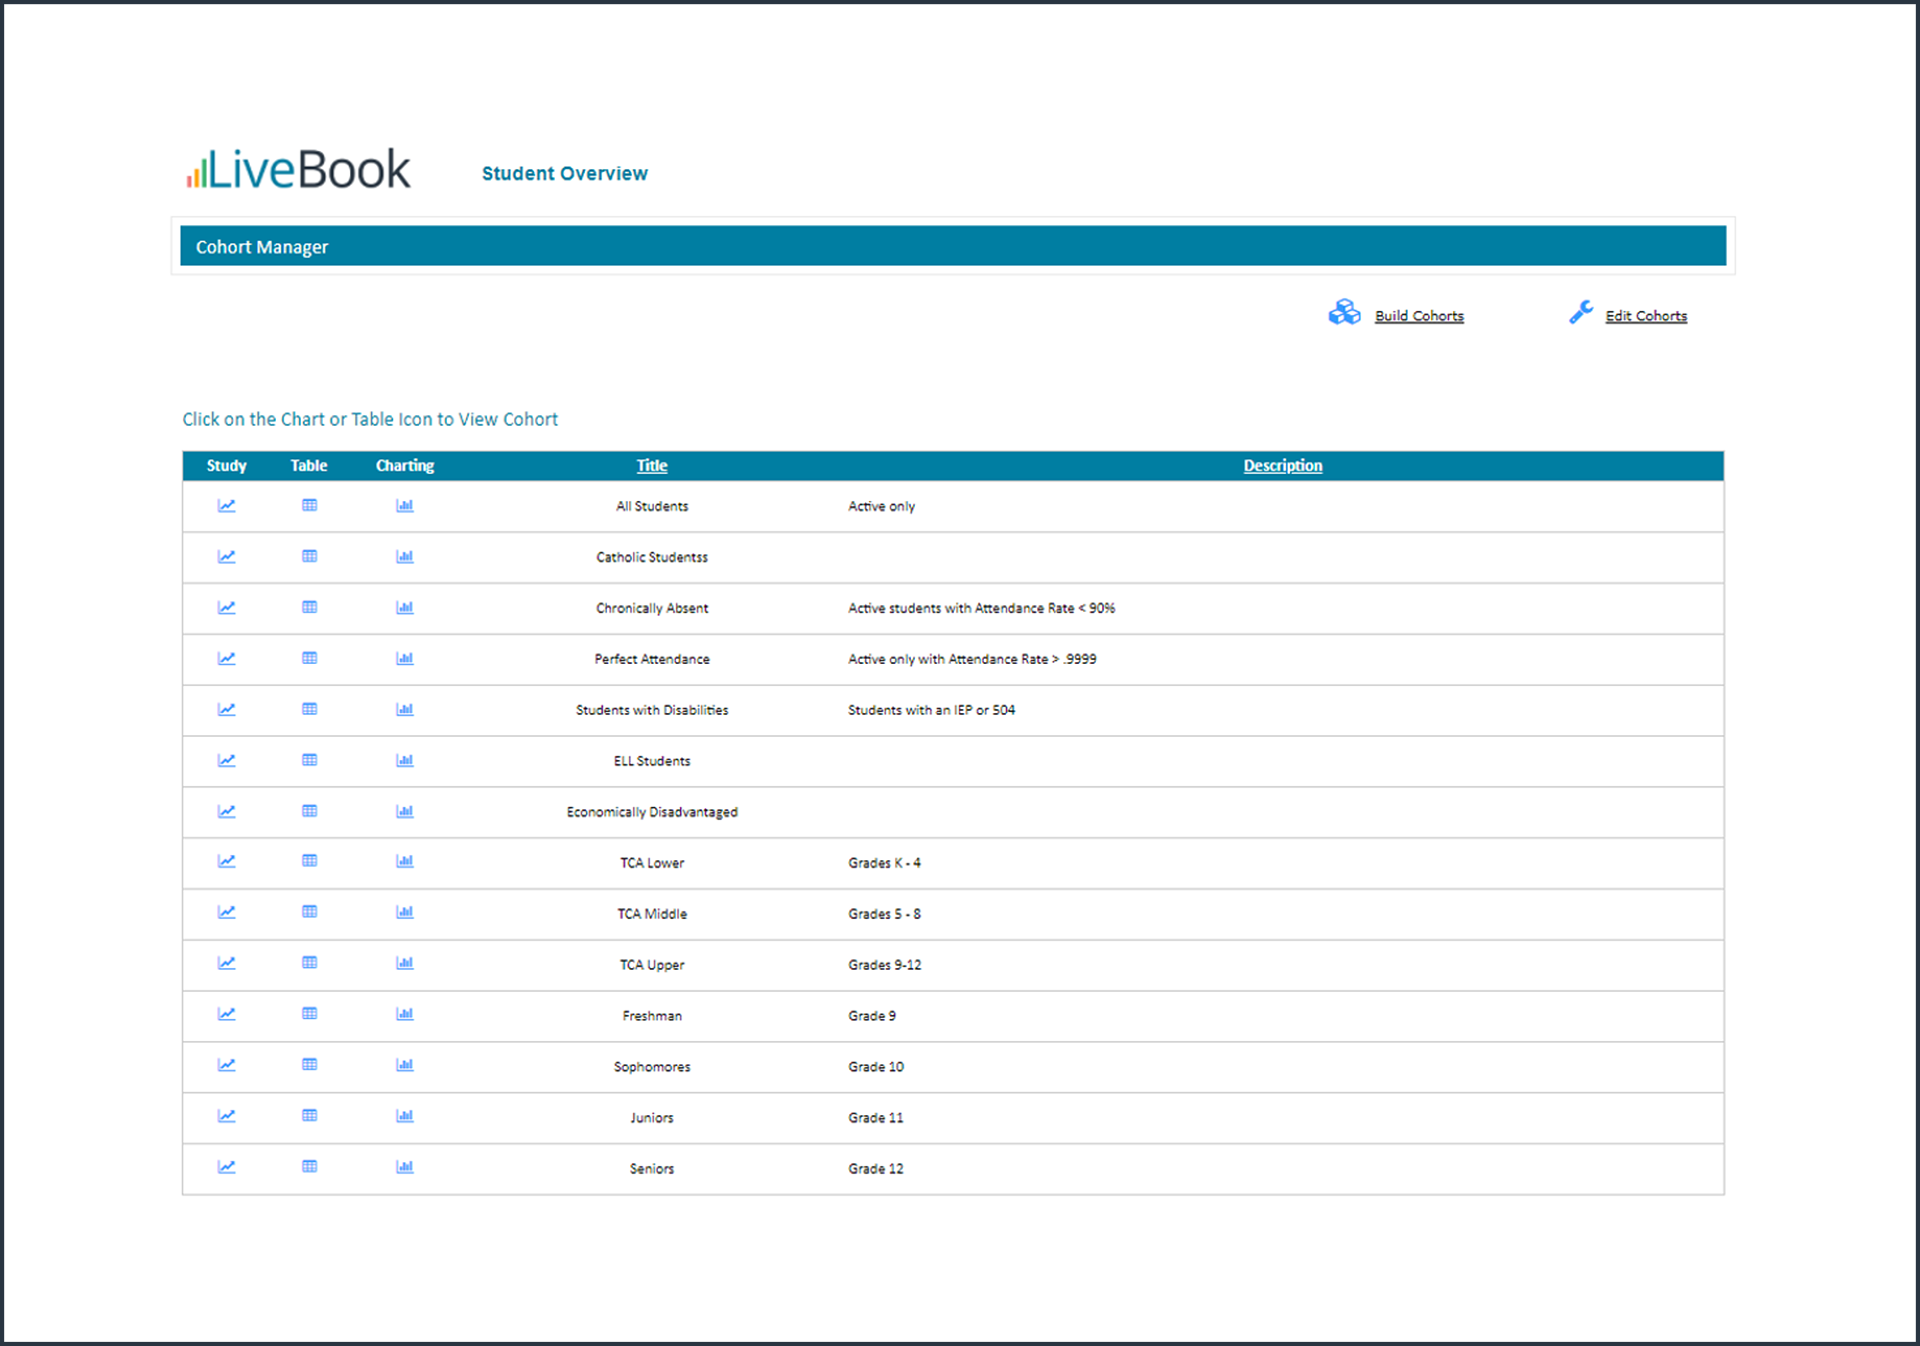
- Cohort Management: Cohorts can be created and saved by users so they can narrow the scope of data to focus on a specific school, grade level, or group of students.
- Spot Trends: Multiple data visualizations can be displayed at once to see correlations and trends that may have otherwise gone unnoticed.
- Current Info: Integration with our AdminPlus SIS means all information is up to date (such as Special Ed and ELL statuses).
- Easy Access: Drill down to the Student Snapshot to see more detail on student performance.
- Easy Look-Up: All assessment data is keyed to a student's unique ID and presented in color-coded table views, making it easy to understand.
- Single Sign-On: LiveBook Single Sign-On from our TeacherPlus Gradebook means teachers always have access to the data they need for students in their current section rosters.
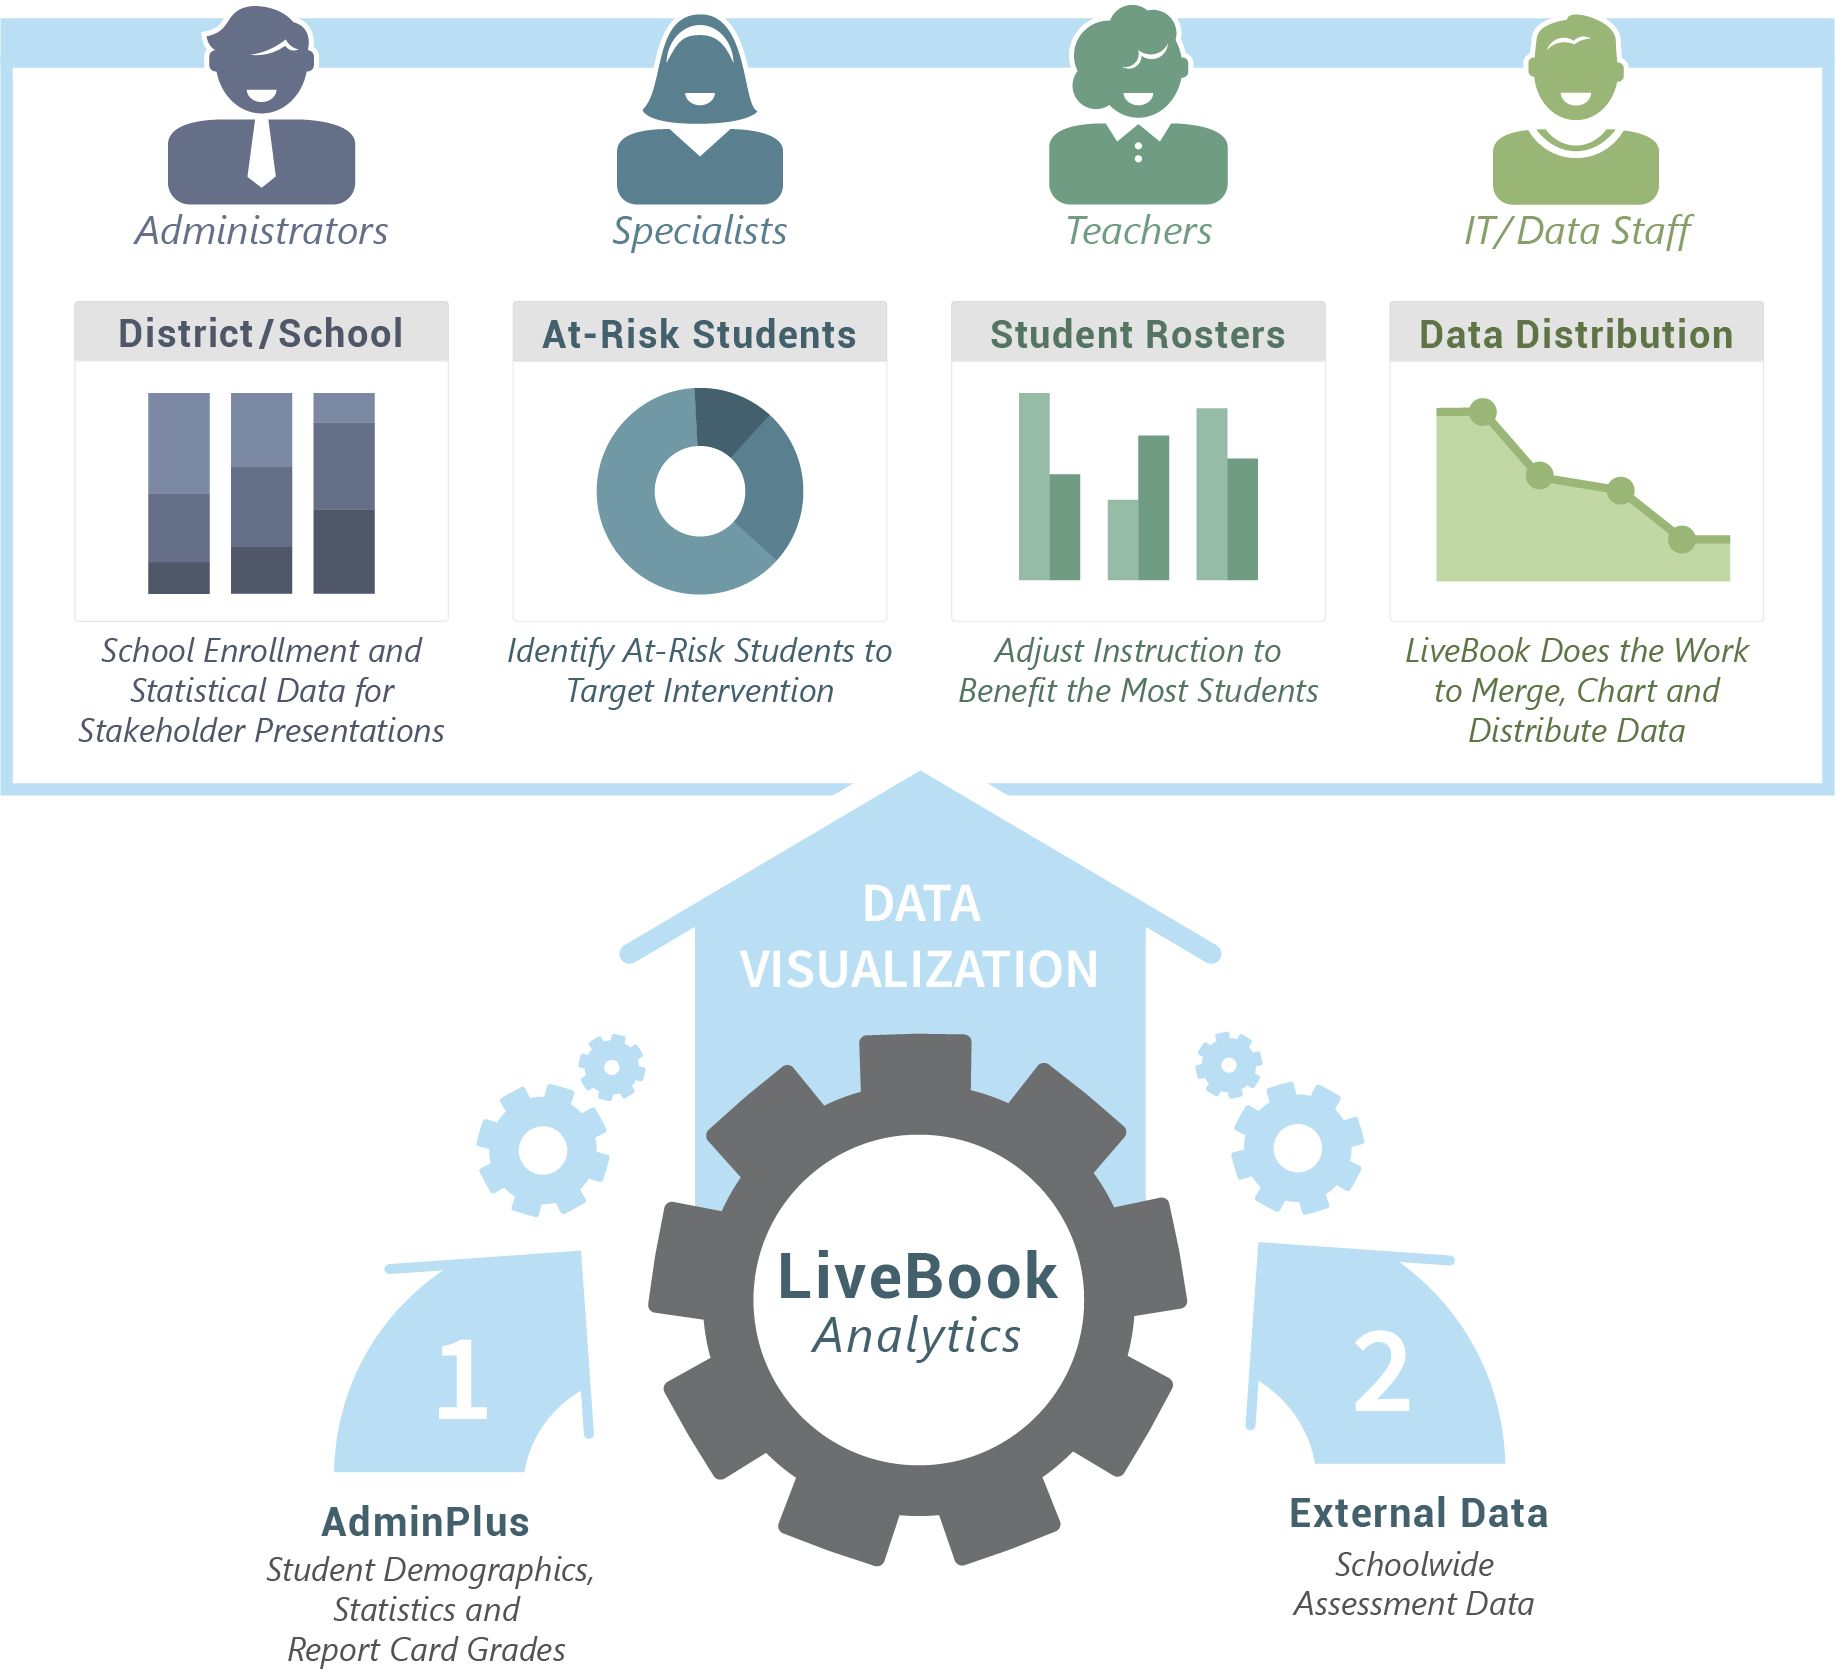
A Better Way to Analyze and Visualize School Data that Keeps Everyone Happy
Administrators
Show visualizations to highlight your schools' identified strengths, enrollment statistics and increased achievement - it's all about good PR.
Specialists
Compare student performance on different assessments and identify students that are not meeting benchmarks or are barely missing the next achievement level.
Teachers
Single sign-on access to current students' assessment history, color-coded to quickly see differences in achievement, with multiple tools to query and visualize the data.
IT/Data Staff
Simplify the process of collecting and merging data and eliminate the need to distribute the data to administrators, specialists, and classroom teachers.
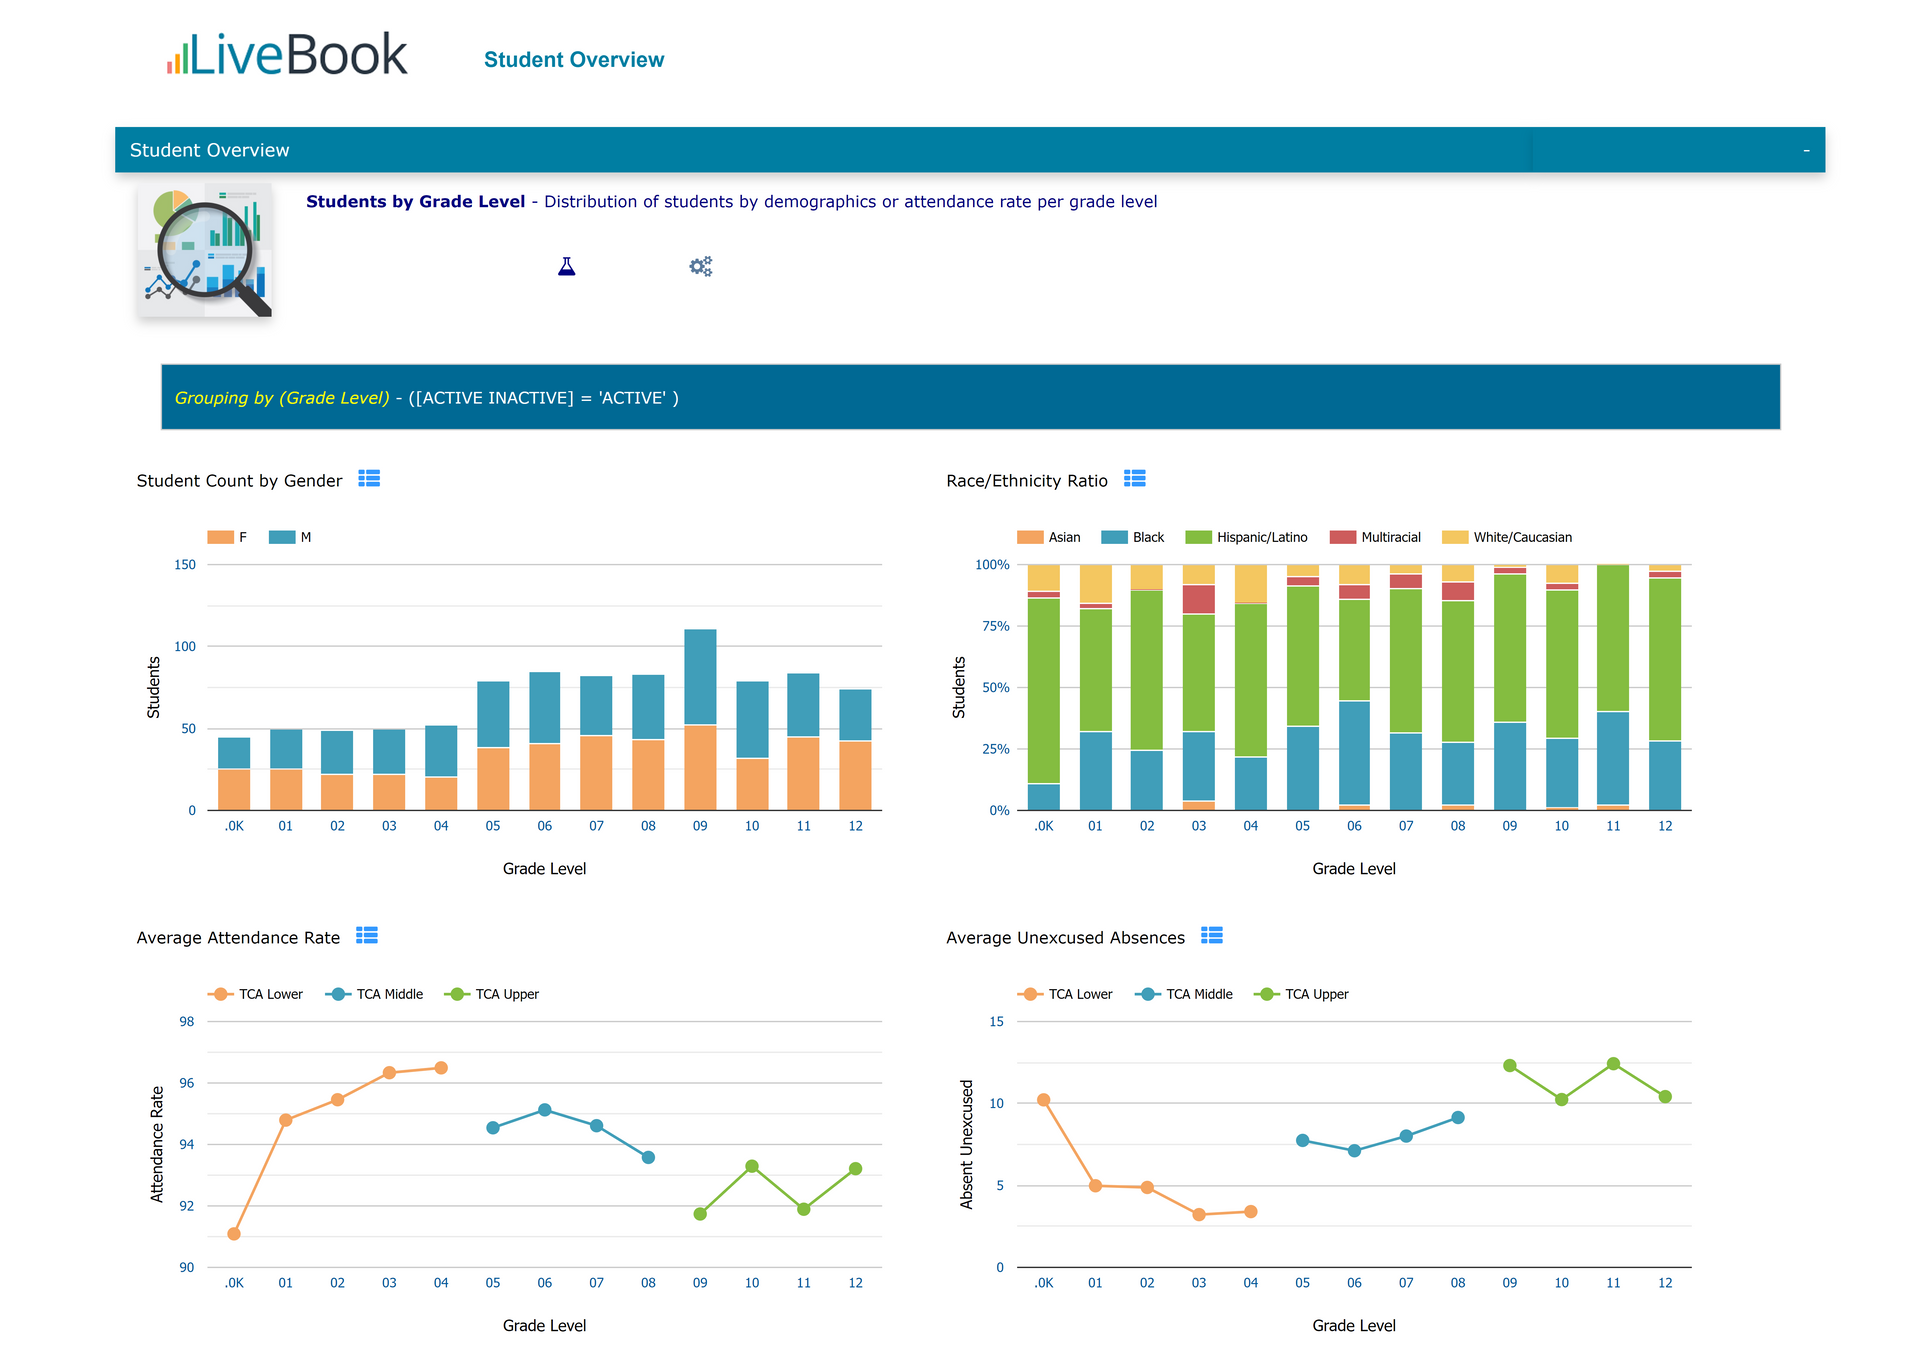
AdminPlus Chapters for LiveBook
Student Overview | Department Summary | Enrollment History
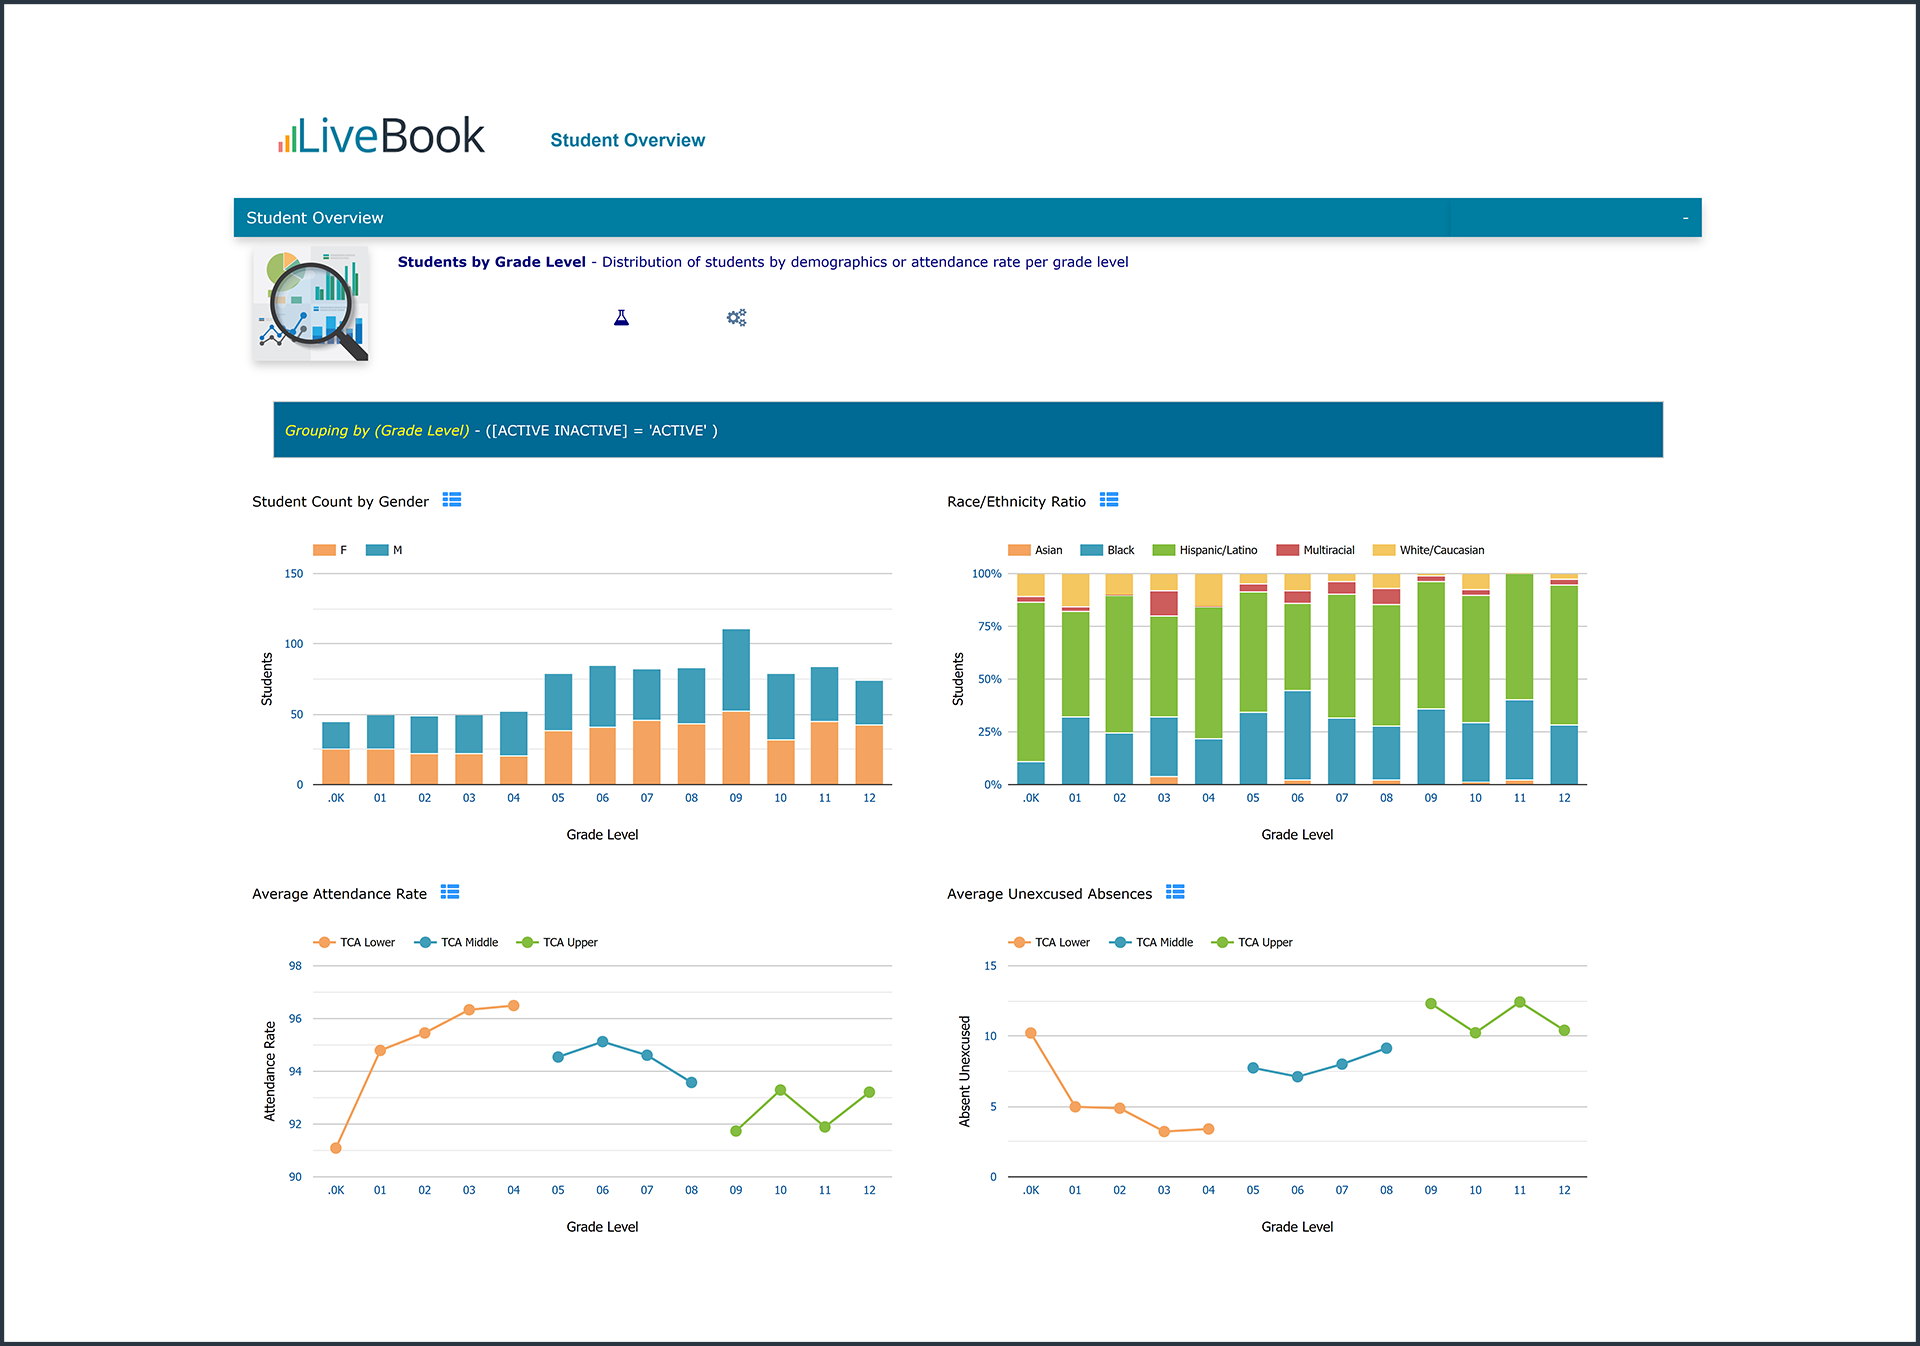
LiveBook, powered by Rediker Software, enables analysis and visualization of AdminPlus data and schoolwide assessments. The pre-packaged AdminPlus “chapters” brings to life core data elements common to all AdminPlus schools – demographics, enrollment data, attendance, department/course/section report card grades, and more. Leveraging over a dozen visualization types including stacked column, line, scatter, bubble, box, and whisker, AdminPlus Chapters for LiveBook allow non-tech savvy users to understand and evaluate the information. Additional dynamic features such as drill downs, cohort creation, and filtering enable the user to make informed data-driven decisions quickly. Learn more about AdminPlus Chapters »
Single Sign-On for Teachers
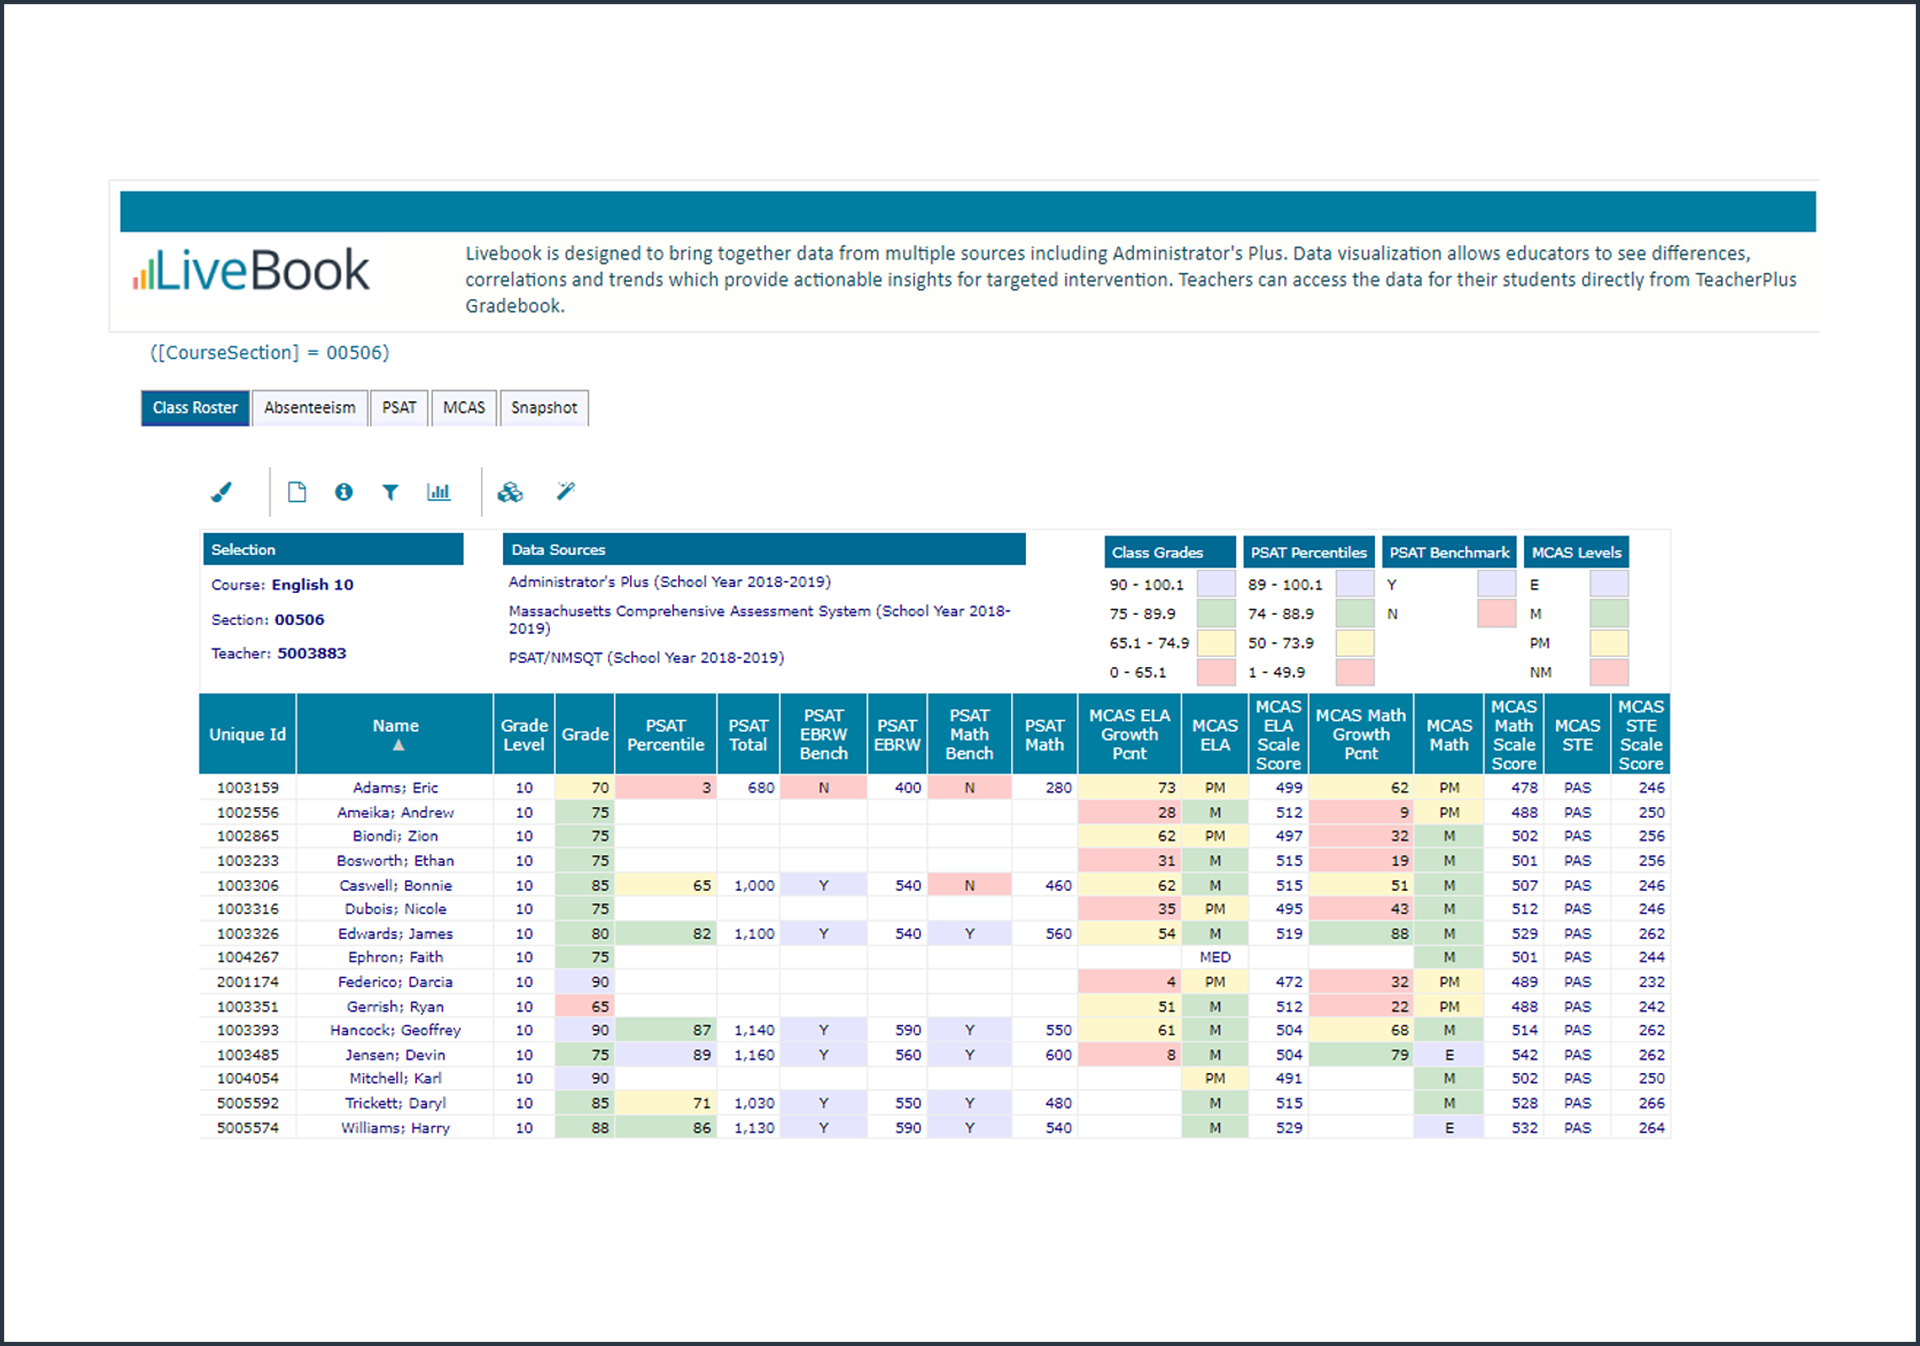
Single sign-on from Rediker Software's TeacherPlus Gradebook allows your teachers to access the Teacher’s View in LiveBook. The Teacher View brings together key demographics, daily attendance totals, discipline totals, and schoolwide assessment results. Data is color-coded to help the teacher quickly identify students with concerns so they can recommend or provide additional help.
Benefits of the LiveBook Teacher View include:
- "One-click" access from TeacherPlus Gradebook to LiveBook.
- Centralized view of student data from one or multiple course sections.
- View and filter on report card grades, demographics, daily attendance totals, discipline totals, and latest standardized assessments color-coded for ease of interpretation.
- Comparison tools to show how individuals compare with others in the class on key metrics.
- Built-in information library for quick access to Assessment Reference materials.
- Comment feature to allow educators to collaborate on intervention by entering notes concerning a student that can be viewed on the Student Snapshot.
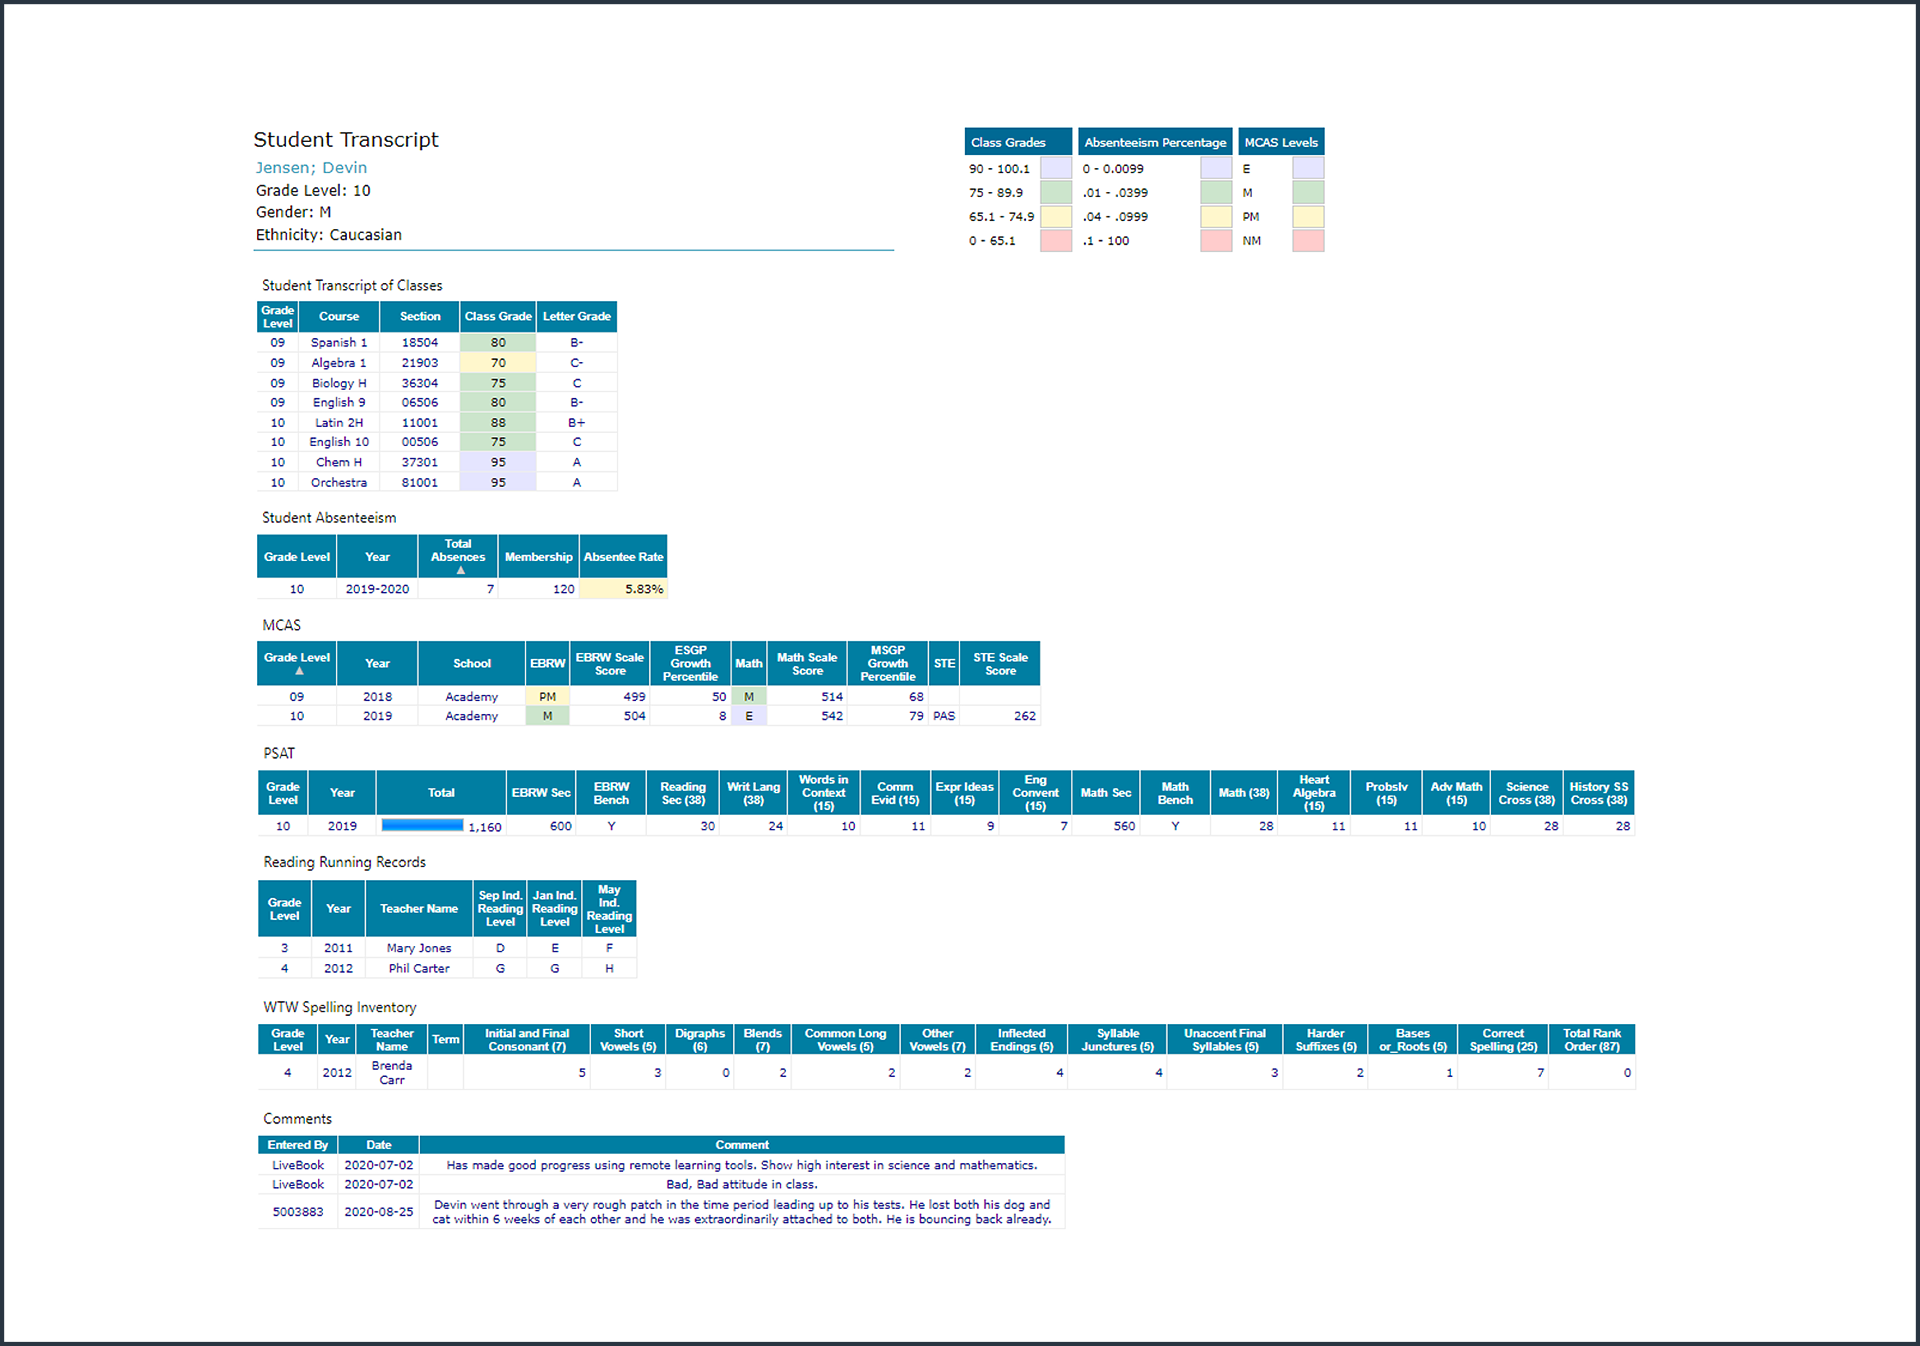
- Student Snapshots of individual students' profile, transcript and assessment history.
Save Time with LiveBook
With LiveBook, the time-consuming work of merging and organizing all the relevant data from various sources is done for you! Data is compiled into a wide range of meaningful tables and charts that allow educators to visualize trends and make data-driven decisions. It’s as easy as 1-2-3!
- AdminPlus data including relevant demographics is imported nightly to LiveBook.
- Schoolwide assessment data is uploaded to a Secure FTP Data folder provided.
- LiveBook processes the data files which updates the various views and analytics.
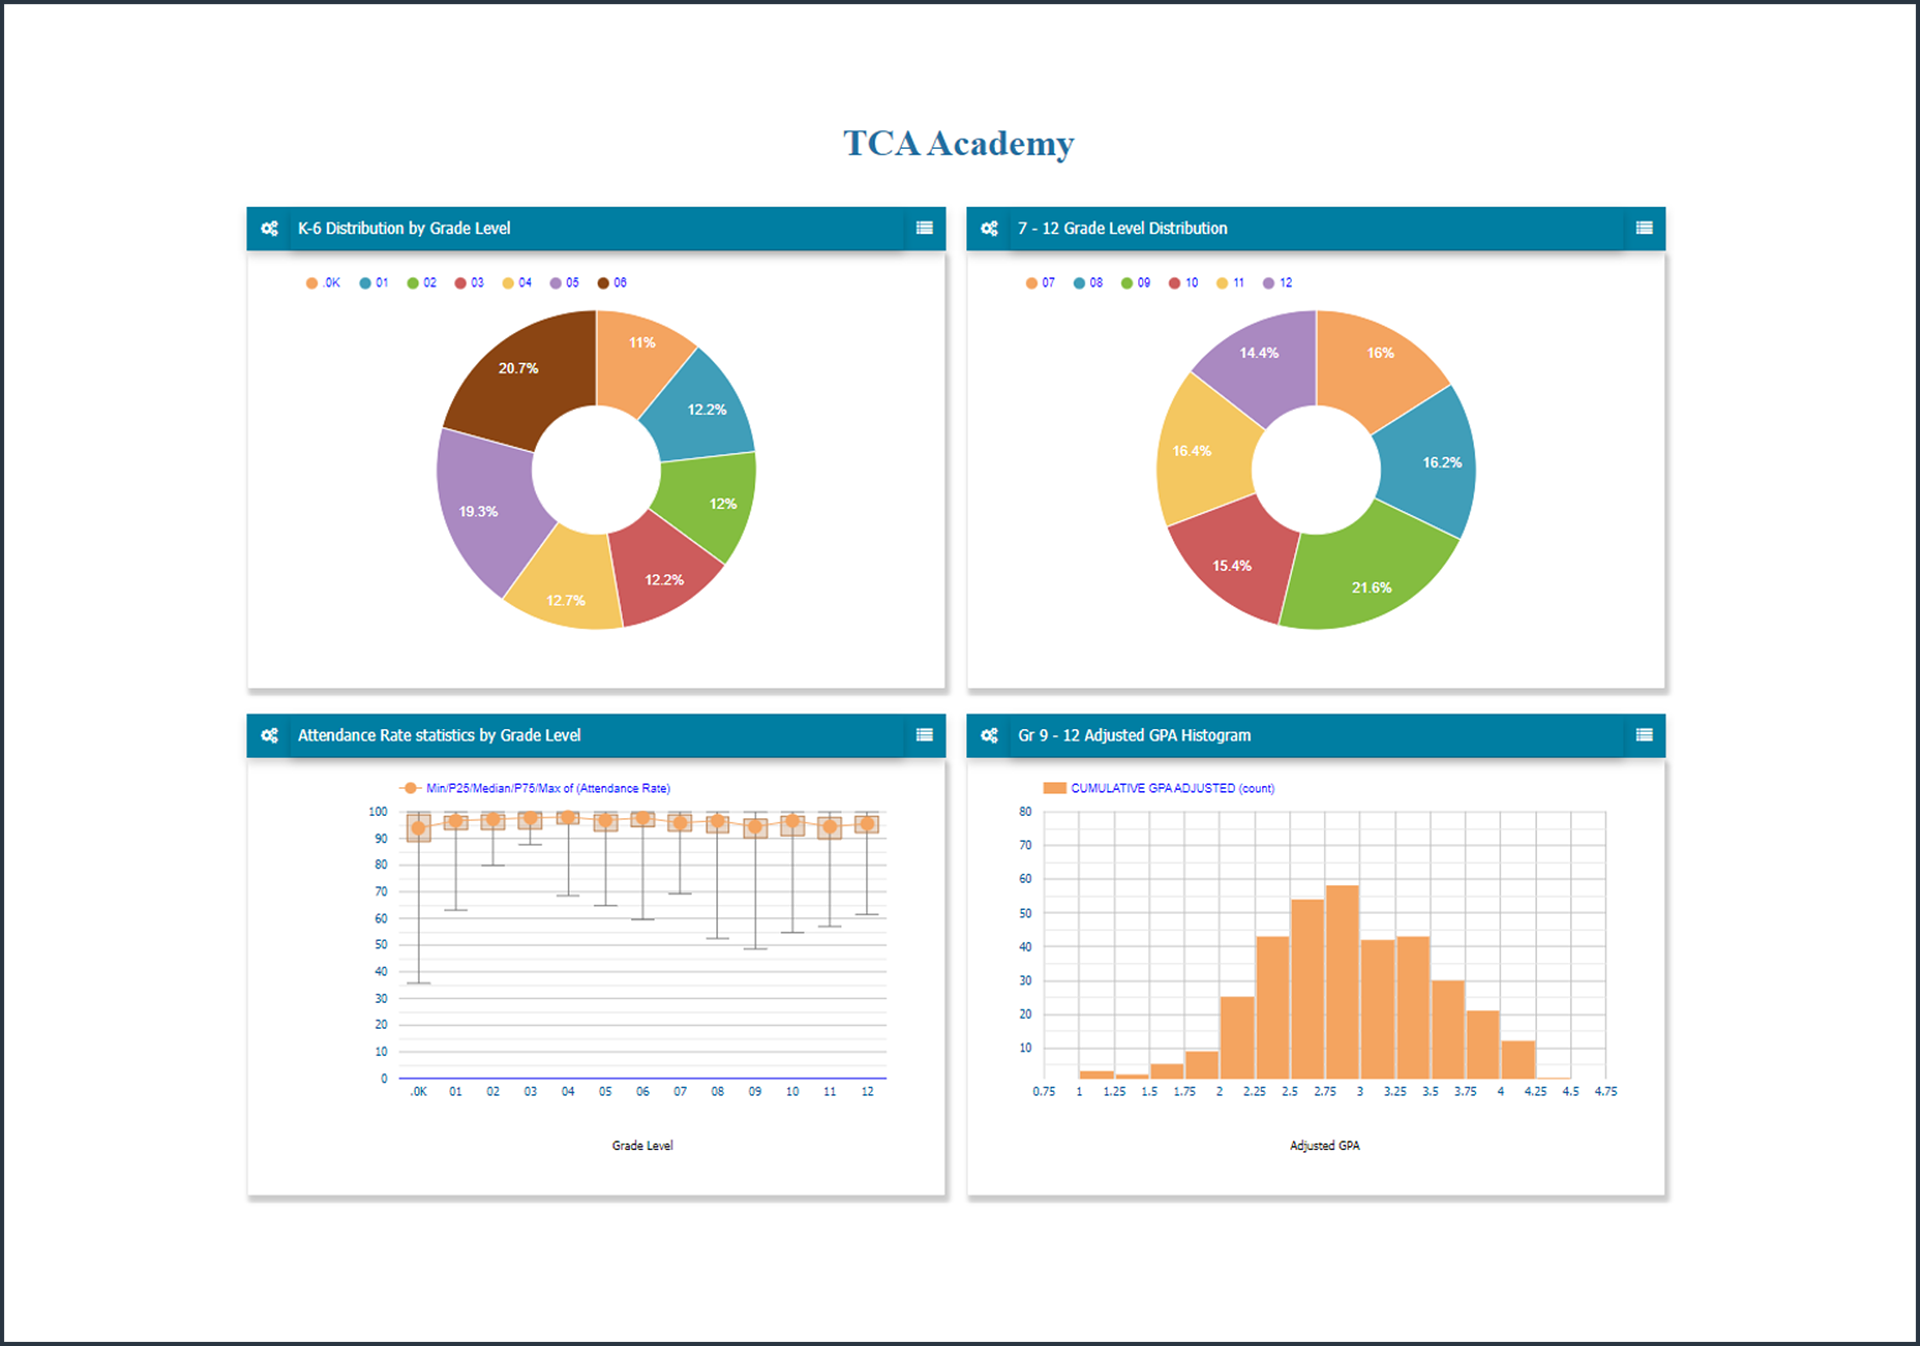
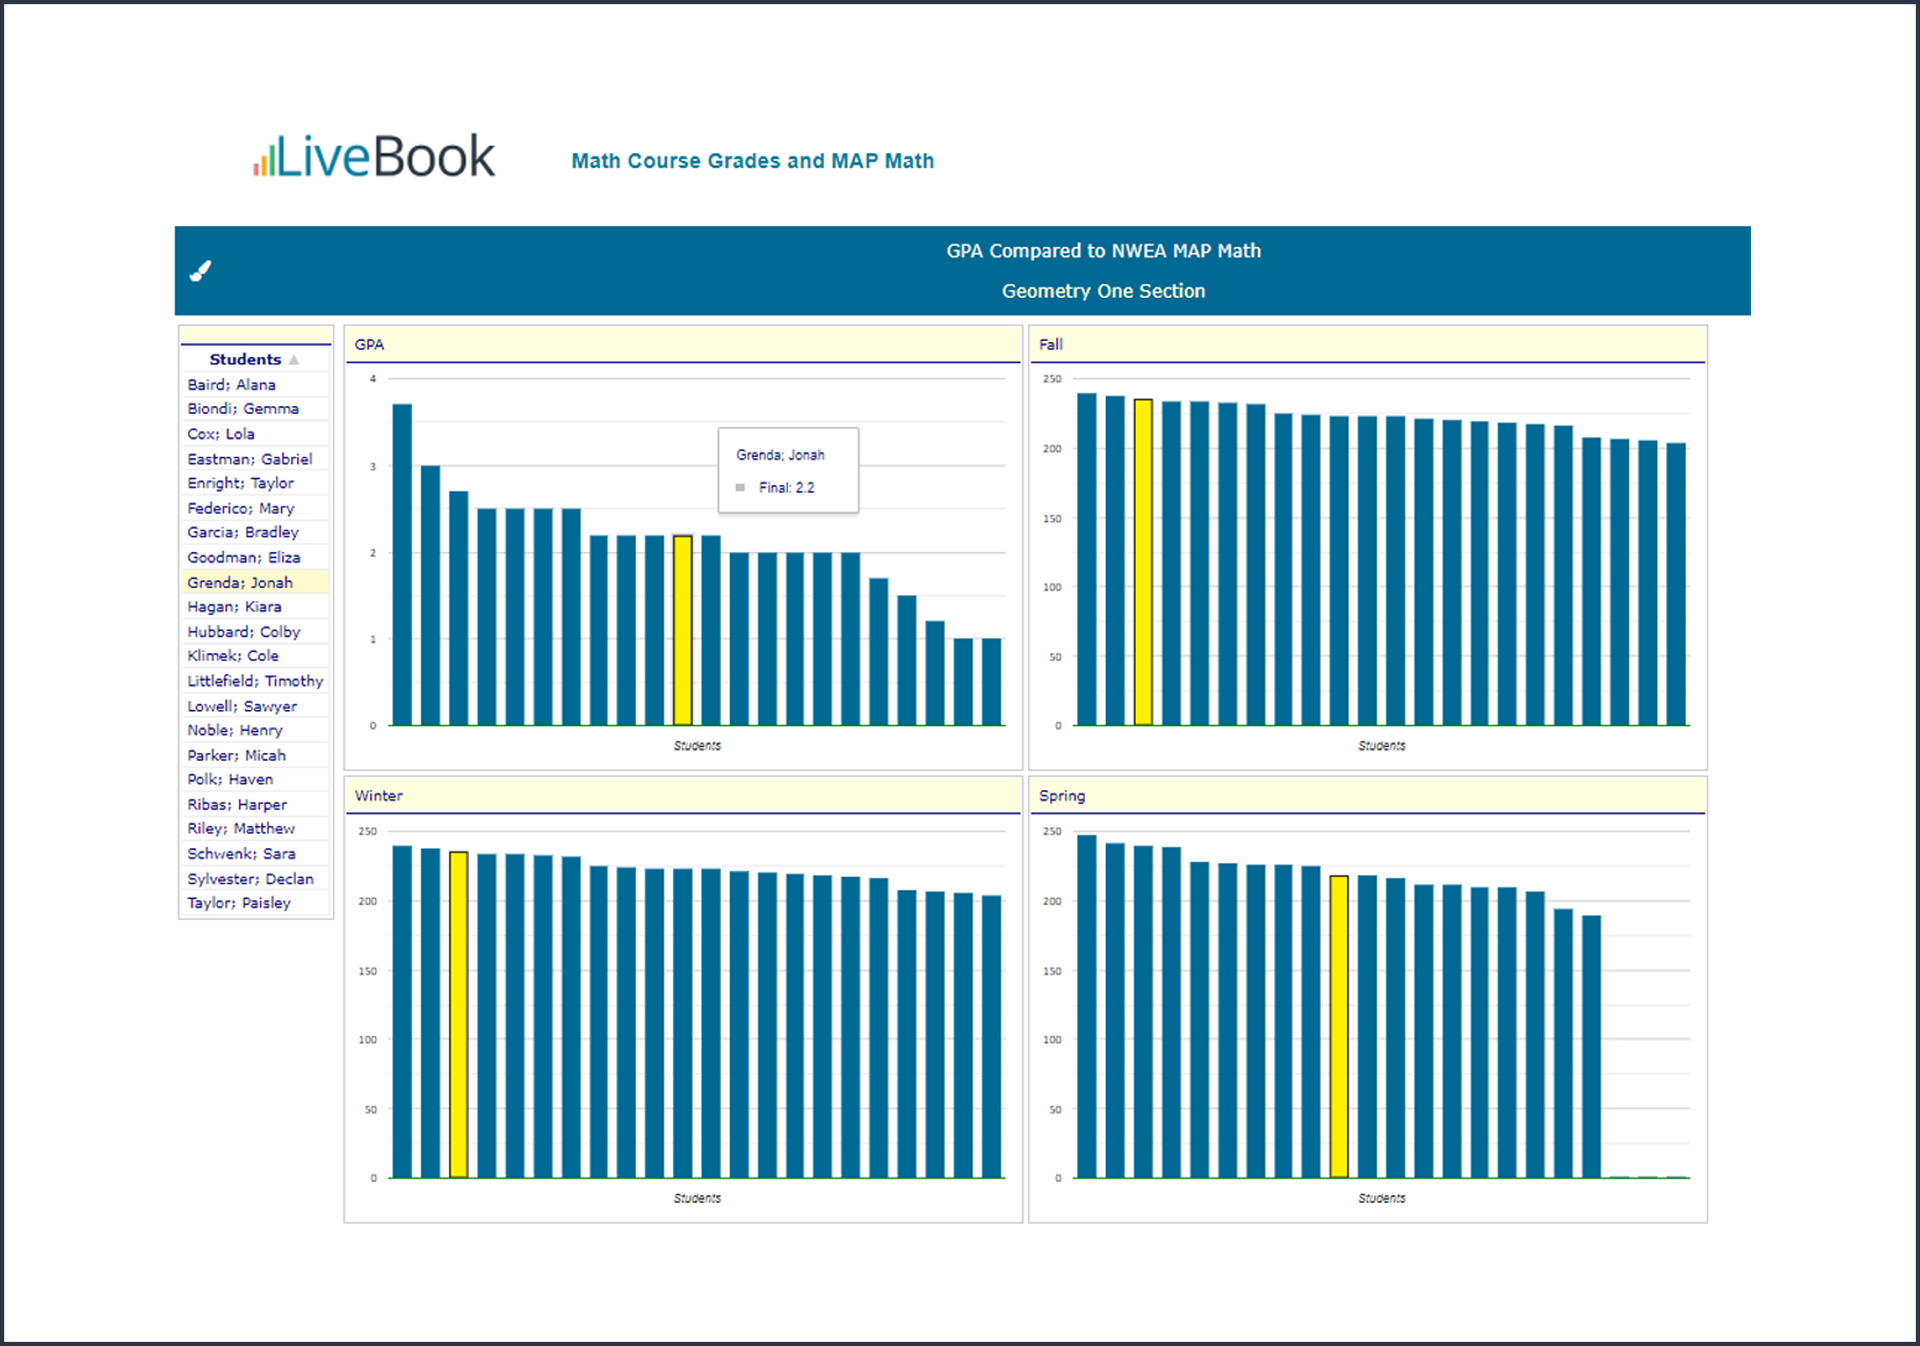
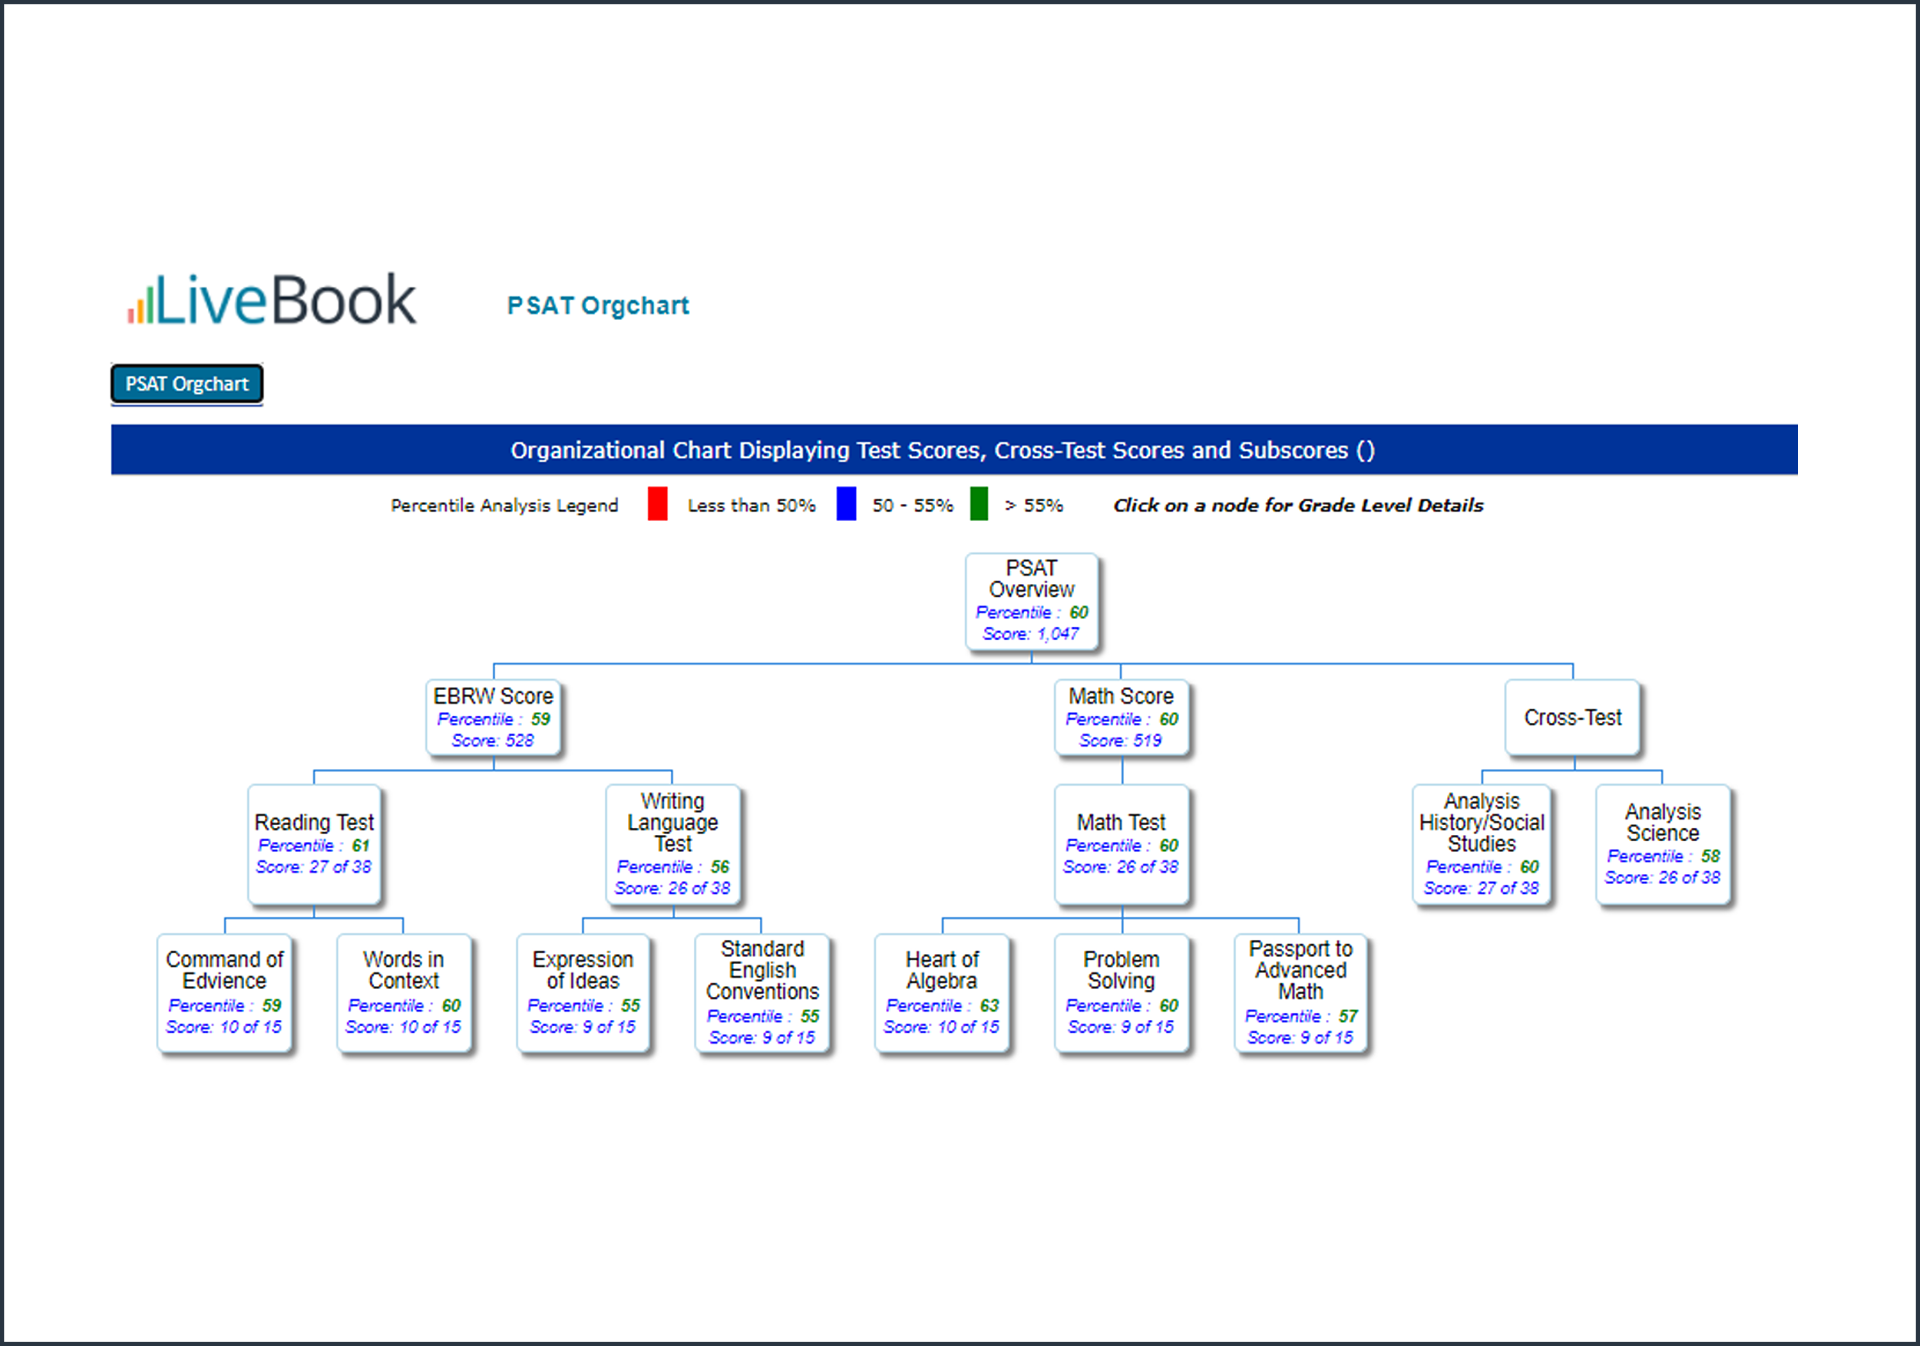
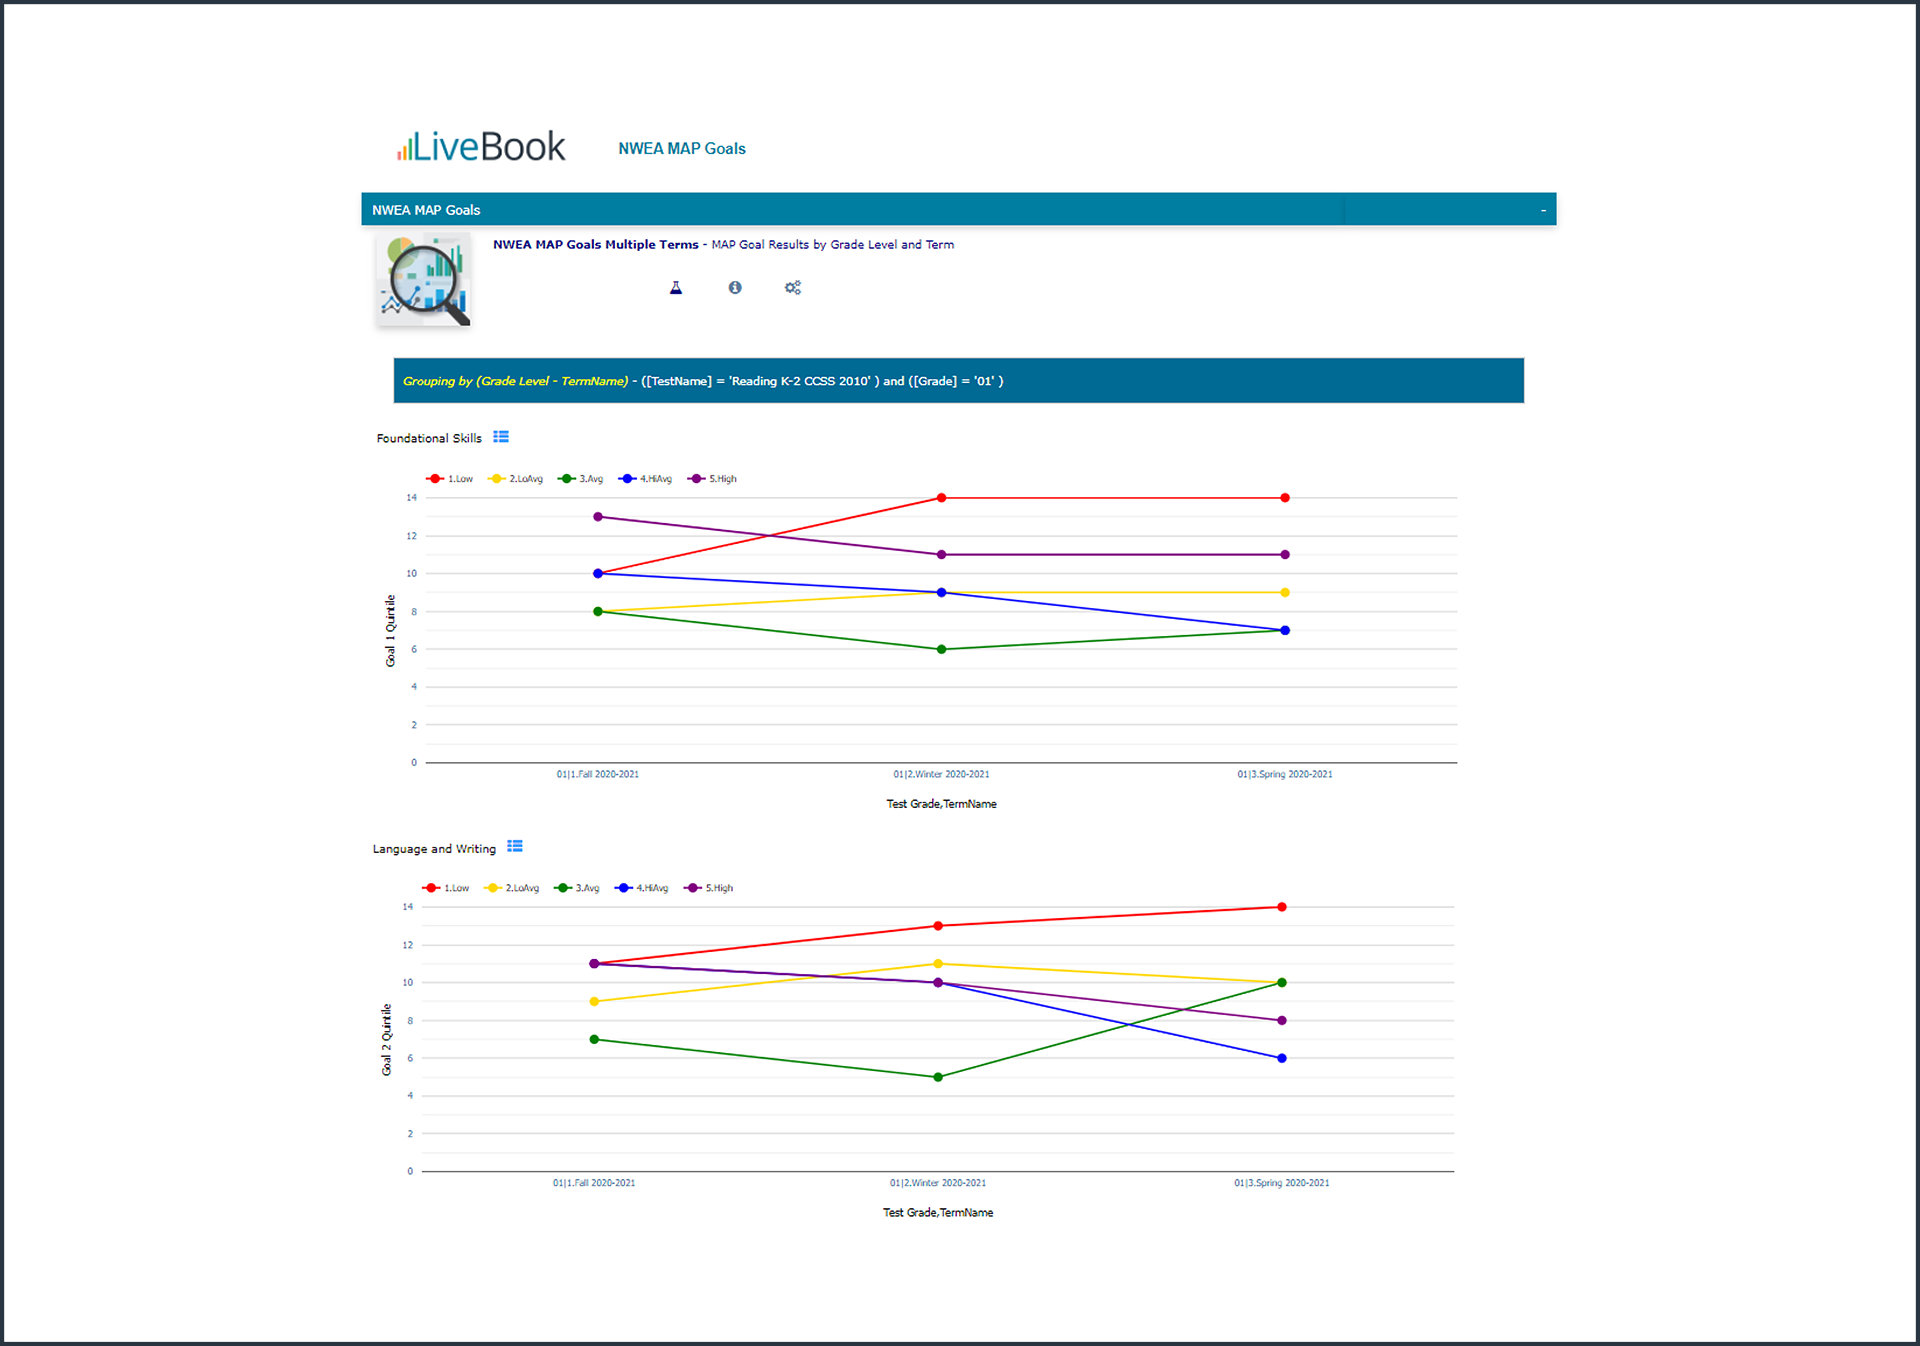
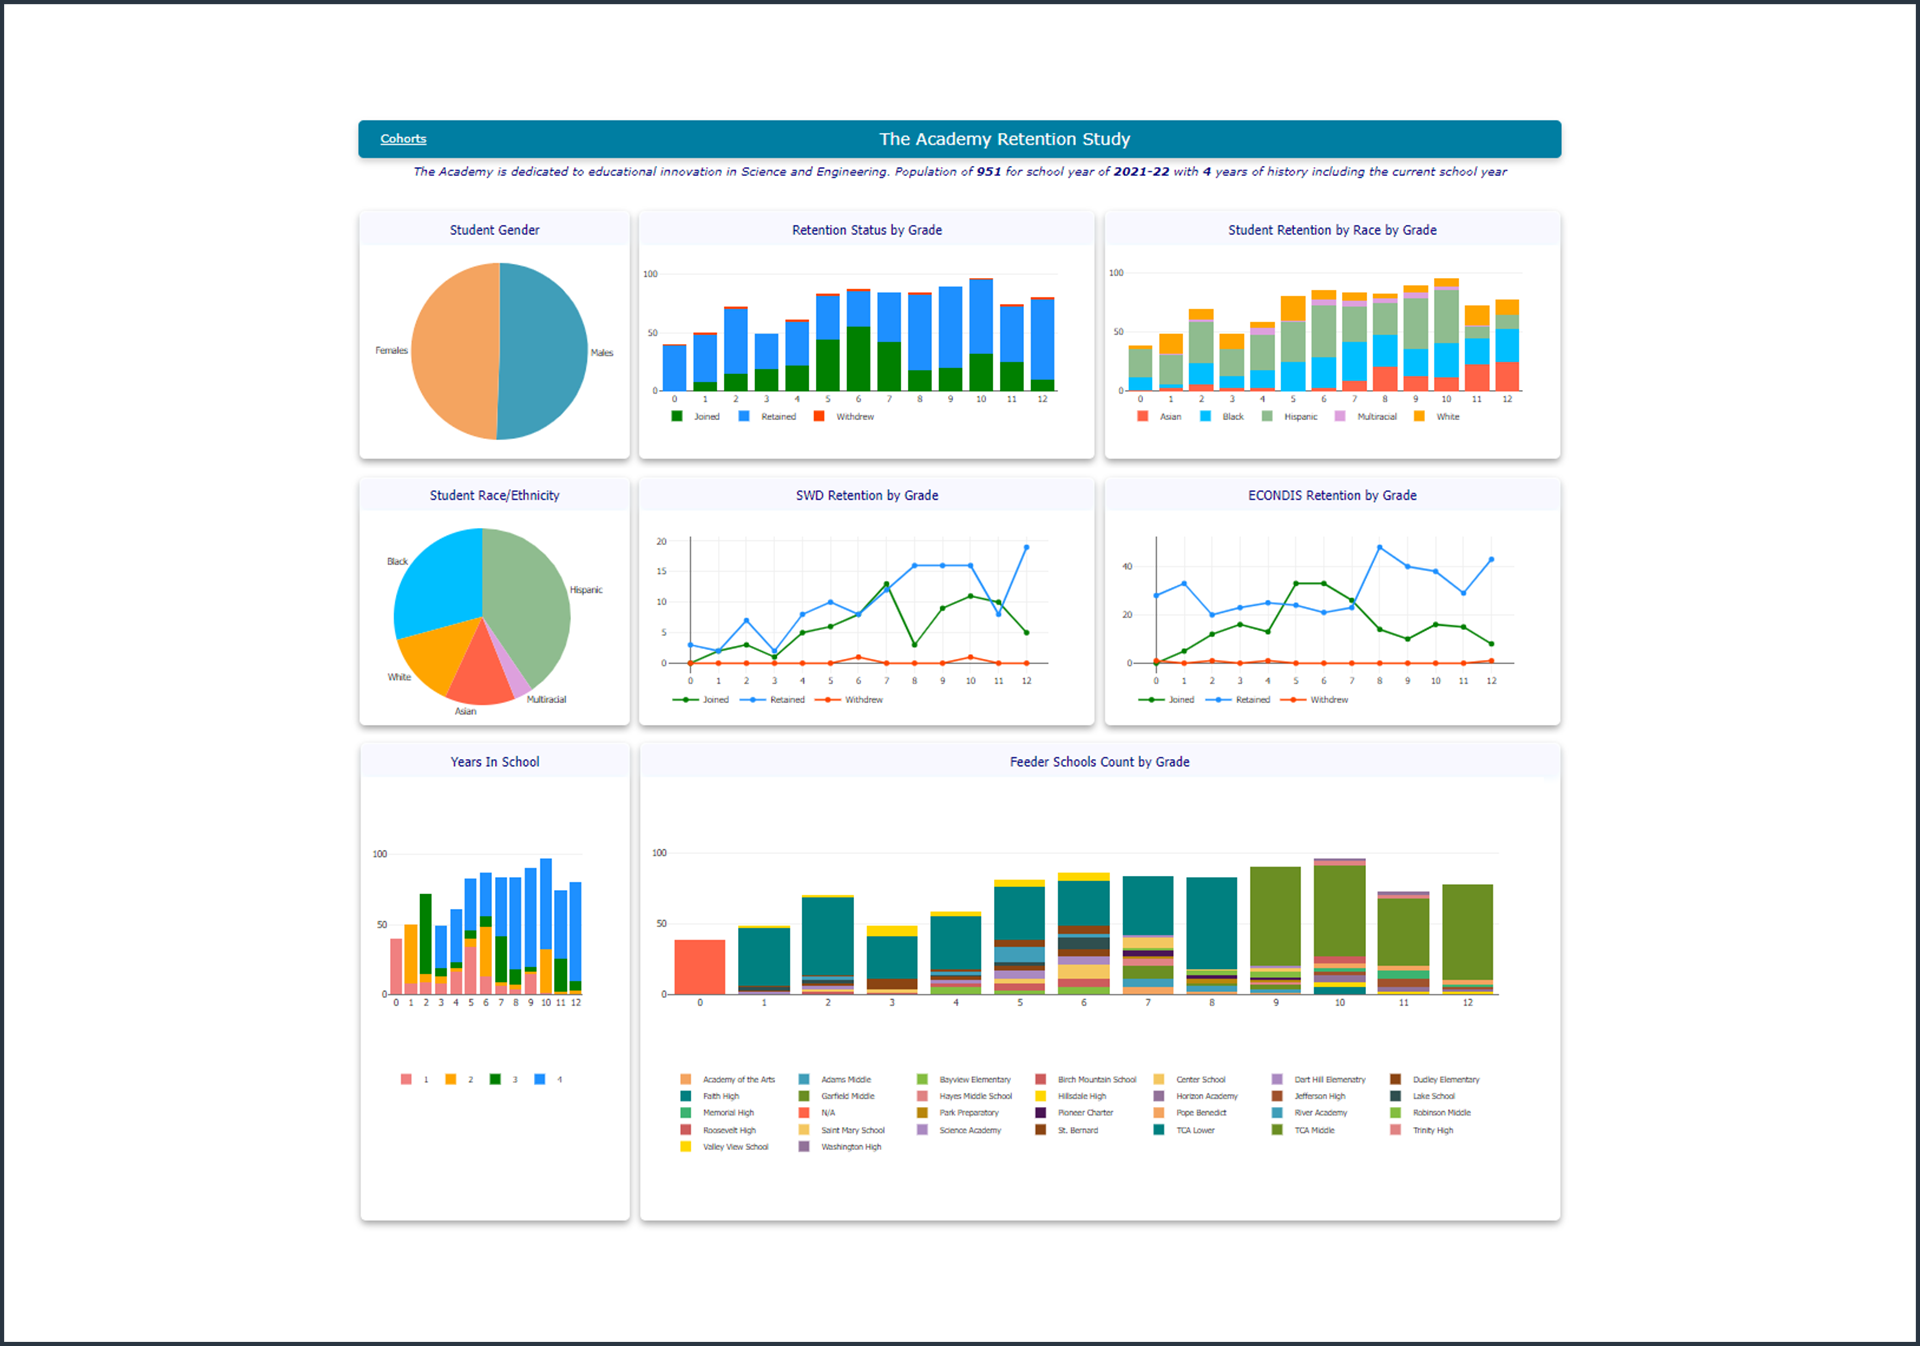
Charting Presentations
The built-in Charting Presentation Manager empowers LiveBook users to create custom presentations tailored for any audience such as school board members, staff and parents. Choose from a plethora of chart types including, Histogram, Pie, Combo, Bubble, Tree Map, Box-Whisker, DataGrid, and Radar. Customize your layout, include a header and detailed sidebar, set labels, define a benchmark or constrain the data to a certain range, all to support the narrative. Learn more about the Charting Presentation Manager »
LiveBook Product Gallery
Default title
Default description
Rediker Software, Inc., 2 Wilbraham Road, Hampden, MA 01036
© 2023 Rediker Software, All Rights Reserved | Terms & Privacy Policy